Introduction
Two major regulatory authorities set widely referenced standards for dissolution testing: the United States Pharmacopeia (USP) and the European Medicines Agency (EMA). While both aim to ensure safe, effective, and consistent drug performance, their focus differs. The USP primarily provides compendial methods and acceptance criteria designed for quality control testing of marketed products, whereas the EMA emphasizes the use of dissolution as a tool to establish bioequivalence, justify biowaivers, and support in vitro–in vivo correlations (IVIVC). Understanding these differences is essential for successful global submissions.
For example
when filing a generic application in the United States, demonstrating compliance with USP <711> Dissolution may be sufficient for establishing quality standards. However, an equivalent European submission requires comparative dissolution profiles across multiple pH conditions (typically pH 1.2, 4.5, and 6.8) and statistical similarity assessments using the f₂ similarity factor. Missing such analyses can lead to requests for additional data or even regulatory rejection.
Moreover, regulators in both regions increasingly expect companies to justify each parameter in their dissolution method from the choice of apparatus and agitation speed to medium composition and deaeration. Simply adopting a compendial method is no longer enough. Instead, dossiers must demonstrate that the method is discriminatory, reproducible, and clinically relevant.
For regulatory specialists, this means mastering not only the technical aspects of dissolution science but also the regulatory logic behind each guideline. Knowing how USP and EMA requirements align and where they diverge allows for proactive dossier preparation, minimizes deficiency letters, and facilitates faster approvals.
This article provides a step-by-step actionable guide to navigating USP and EMA dissolution guidelines. Each section highlights practical differences, regulatory expectations, and real-world examples, along with actionable tips for dossier preparation. , you will have a structured framework for interpreting, applying, and documenting dissolution data in a way that withstands scrutiny from both US and European regulators.
Step 1: Understand the Regulatory Framework
The first step for regulatory affairs specialists is to build a clear understanding of the regulatory framework governing dissolution testing in the United States and Europe. Both USP and EMA emphasize dissolution as a critical quality attribute (CQA), but the scope and purpose differ:
USP Perspective
- The United States Pharmacopeia (USP) defines dissolution testing primarily through:
- USP <711> Dissolution: Core requirements for apparatus, media, conditions, and acceptance criteria.
- USP <1092> The Dissolution Procedure: Development and Validation: Guidance on developing and validating discriminatory methods.
- USP guidelines focus on quality control (QC) applications, providing standardized methods that ensure lot-to-lot consistency and compliance during the commercial phase.
- For example, a marketed immediate-release tablet may need to meet Stage 1 (S1) acceptance criteria: 6 units tested, each unit not less than Q + 5% dissolved at the specified time.
For example
For example, a marketed immediate-release tablet may need to meet Stage 1 (S1) acceptance criteria: 6 units tested, each unit not less than Q + 5% dissolved at the specified time.
EMA Perspective
- The European Medicines Agency (EMA) dissolution requirements are mainly outlined in the Guideline on the Investigation of Bioequivalence (2010).
- EMA’s focus is broader: dissolution is a tool not only for QC but also for:
- Comparative bioequivalence studies (test vs. reference).
- Biowaivers (e.g., BCS Class I and III).
- IVIVC (in vitro–in vivo correlation) during development.
- The EMA requires dissolution testing across multiple pH media (1.2, 4.5, and 6.8) to simulate physiological conditions. In comparative studies, similarity must be demonstrated using the f₂ similarity factor, with f₂ values between 50 and 100 indicating similarity.
Key Differences
USP: QC-oriented, apparatus/media details, compendial compliance.
EMA: Biorelevance-focused, comparative data, statistical justification.
Example
A U.S. submission for a generic paracetamol tablet may reference USP <711> and provide QC acceptance criteria at pH 5.8 phosphate buffer. The same product submitted in Europe must also present comparative dissolution profiles at pH 1.2, 4.5, and 6.8 against the reference product and show f₂ ≥ 50 for similarity. Without this, the EMA may request additional BE studies.
Actionable Tips for Regulatory Affairs Specialists
- Map submission regions early: Decide whether the dossier will target the U.S., EU, or both, and align dissolution strategies accordingly.
- Always cite the correct guideline: USP <711>/<1092> for U.S. QC; EMA Bioequivalence Guideline (2010) for EU comparative studies.
- Prepare cross-justification: If one dissolution method is used globally, provide both USP compliance and EMA-style comparative data to avoid regulatory delays.
Step 2 — Define the Purpose of the Dissolution Test
Before designing or submitting dissolution data, regulatory affairs specialists must define the purpose of the test. Both USP and EMA recognize that dissolution serves multiple roles, but each purpose requires a different design, acceptance criteria, and justification.
1. Quality Control (QC) Testing: USP Focus
- Objective: To ensure batch-to-batch consistency and detect manufacturing changes that could impact drug release.
- USP’s emphasis: QC dissolution is standardized, using compendial conditions (media, apparatus, rpm).
Example
For an immediate-release ibuprofen tablet, the USP specifies dissolution in 900 mL pH 7.2 phosphate buffer using Apparatus II (paddle) at 50 rpm. Compliance requires ≥ 80% dissolved in 60 minutes.
2. Comparative Dissolution: EMA Focus
- Objective: To compare a test product with a reference product as part of bioequivalence (BE) assessment.
- EMA requirement: Dissolution profiles should be generated in at least three media (pH 1.2, 4.5, and 6.8).
- Similarity Factor (f₂) is used for comparison: f2=50–100⇒Profiles are similar
- Example: A generic metformin hydrochloride tablet must demonstrate dissolution similarity with the reference product at all three pH conditions. If f₂ < 50 at pH 4.5, additional BE studies may be requested.
Example
A generic metformin hydrochloride tablet must demonstrate dissolution similarity with the reference product at all three pH conditions. If f₂ < 50 at pH 4.5, additional BE studies may be requested.
3. Biowaivers (BCS-Based): EMA Special Case
- EMA allows biowaivers (no in vivo BE study required) for:
- BCS Class I (high solubility, high permeability) drugs.
- BCS Class III (high solubility, low permeability) under strict conditions.
- Dissolution must show rapid release (≥ 85% in 30 min) in pH 1.2, 4.5, an6.8, for both test and reference.
Example
A BCS Class I drug like propranolol hydrochloride may qualify for a biowaiver if dissolution is rapid across media.
4. IVIVC (In Vitro–In Vivo Correlation)
- Objective: To establish a predictive relationship between dissolution and plasma concentration.
- Often required for modified-release (MR) formulations.
- USP <1092> provides guidance on method validation for IVIVC.
Example
For an extended-release nifedipine tablet, dissolution at multiple time points (e.g., 2h, 4h, 8h, 12h) may be correlated with pharmacokinetic data.
Step 3: Select the Dissolution Apparatus and Media
Choosing the correct apparatus and media is one of the most scrutinized aspects in regulatory submissions. Both USP and EMA provide clear but slightly different expectations.
1. Dissolution Apparatus: Regulatory Landscape
USP Guidance
- USP <711> specifies Apparatus I (basket) and Apparatus II (paddle) as the most common choices.
- Apparatus III (reciprocating cylinder), IV (flow-through cell), V–VII (less common) may be justified for complex dosage forms.
EMA Guidance
- EMA does not prescribe a specific apparatus but expects justification based on dosage form characteristics and scientific rationale.
- For immediate-release solid orals, Apparatus II is most common. For modified-release, Apparatus I or IV may be preferred.
Example
For a film-coated paracetamol tablet, USP specifies Apparatus II, paddle at 50 rpm. EMA also accepts this choice if the justification links to product disintegration behavior.
2. Dissolution Media: Composition and Justification
USP Guidance
- Allows single medium for QC purposes, usually compendial buffers or simulated fluids.
- pH range: typically 1.2 (acid), 4.5 (acetate buffer), and 6.8 (phosphate buffer) for method development.
EMA Guidance
- Stricter: requires three pH conditions (1.2, 4.5, 6.8) for comparative dissolution to mimic GI tract variability.
- Surfactants (e.g., SLS) can be used if justified, especially for poorly soluble drugs (BCS II and IV).
Example
For amlodipine besylate tablets (BCS Class I drug), USP allows a single medium (pH 6.8 buffer). EMA requires testing at pH 1.2, 4.5, and 6.8, ensuring rapid release at all three.
3. Volume and Sink Conditions
- Both USP and EMA emphasize sink conditions
- Volumes: Typically 500–1000 mL. Smaller volumes may be acceptable for pediatric formulations, but justification is required.
Example
For fenofibrate (BCS Class II, poorly soluble), sink conditions are not achievable in simple aqueous media. Surfactants (e.g., 0.5% SDS) may be used with proper justification.
4. Agitation Speed (RPM)
- USP: Commonly 50 rpm for paddles, 100 rpm for baskets.
- EMA: Accepts these speeds but requires scientific justification if deviating.
- High rpm (>75) may artificially accelerate dissolution and face rejection unless supported.
Example
For a metoprolol tartrate IR tablet, 50 rpm paddle speed is sufficient to ensure > 85% release within 30 minutes. Increasing to 75 rpm is unnecessary and may raise regulatory concerns.
Step 4: Define Acceptance Criteria (USP Q Values vs. EMA Similarity Requirements)
Once the dissolution method has been established, the next critical step is to define acceptance criteria. This ensures that the test is both discriminatory (detects formulation/process differences) and regulatory compliant.
1. USP Approach: Q Values
The USP sets predefined Q values for dissolution, which represent the percentage of drug that must be dissolved within a specified time frame.
- Immediate-release (IR) tablets/capsules: Typically Q = 80% in 30 minutes, unless otherwise stated in the monograph.
- Modified-release (MR) products: Criteria depend on product-specific monographs (e.g., 20% at 1 h, 50% at 4 h, 80% at 8 h).
- Acceptance Stages (USP <711>):
- Stage S1: 6 units tested; each unit ≥ Q + 5%.
- Stage S2: 12 units total (6 more tested); average ≥ Q, no unit < Q − 15%.
- Stage S3: 24 units total; average ≥ Q, no more than 2 units < Q − 15%, none < Q − 25%.
Example
For a generic paracetamol tablet, USP monograph specifies Q = 80% at 30 minutes. During QC, if 6 tablets show ≥ 85% release at 30 min, the batch passes at S1.
2. EMA Approach: Similarity Factor (f₂)
EMA focuses on comparative dissolution profiles, especially for generic submissions and bioequivalence (BE) assessments.
- The f₂ similarity factor is the key metric:
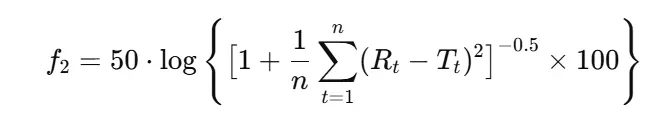
Where:
- n = number of time points,
- Rt = reference % dissolved at time t,
- Tt= test % dissolved at time t.
Regulatory requirements (EMA, 2010):
- Minimum of 12 units per product.
- At least 3 time points (excluding 0 min).
- Variability (CV%) should not exceed 20% at early time points, 10% at later points.
Example
A generic amlodipine 10 mg tablet is compared with the innovator across pH 1.2, 4.5, and 6.8.
If f₂ ≥ 50 in all three media, the product is considered dissolution equivalent → supports biowaiver.

Check out the reactive RADAR chart below comparing f2 VS bootstrap:
3. Harmonization Issues: USP vs EMA
- USP: Dissolution acceptance is mainly QC-focused (batch release, stability).
- EMA: Dissolution acceptance is comparative-focused (generic approval, BE support).
- Both agencies align in requiring scientific justification, but EMA places stronger emphasis on comparability across media.
Step 5: Validate the Dissolution Method (ICH Q2(R2) & Regulatory Expectations)
After establishing the method and defining acceptance criteria, the next regulatory requirement is method validation. Both USP and EMA (via ICH guidelines) mandate that dissolution methods must be validated for their intended use to demonstrate reliability, reproducibility, and regulatory defensibility.
1. Key Validation Parameters (ICH Q2(R2))
Validation of dissolution methods follows the same framework as analytical procedures, with focus on:
Specificity
- Demonstrates that the analyte is measured accurately without interference from excipients, degradation products, or media components.
- Example: Testing placebo tablets under identical conditions ensures no interference in UV or HPLC assay.
Linearity & Range
- Establish a calibration curve across (Q-45%)–120% of the expected concentration range.
- Correlation coefficient (R²) should be ≥ 0.99.
- Example: For a product with Q = 80% at 30 min, standard solutions covering 30–120% dissolution are prepared to confirm linearity.
Accuracy
- Spike recovery studies at multiple levels (e.g., (Q-45%),100%, 120%).
- Recovery typically within 95–105%.
- Example: Spiking amlodipine dissolution medium with known amounts and recovering analyte using HPLC assay.
Precision
- Repeatability (intra-day) and intermediate precision (different analysts/days/instruments).
- %RSD should be ≤ 2% for replicate assays.
Filter Compatibility
- Filters should not adsorb API or release interfering substances.
- Compare filtered vs. centrifuged samples.
- Example: If 0.45 μm PVDF filters adsorb drug, switch to nylon or PTFE filters.
Solution Stability
- Verify that the analyte is stable in the dissolution medium for the full sampling duration (e.g., 24 h).
- Example: If drug degrades in pH 1.2 after 8 h, a shorter maximum sampling time must be set.
Robustness
- Assess sensitivity of the method to small changes in critical parameters:
- pH ± 0.05 units
- Agitation ± 5 rpm
- Temperature ± 0.5 °C
- Medium volume ± 50 mL
- Method should remain unaffected.
2. USP vs EMA Expectations
- USP
- Emphasizes validation mainly for QC purposes.
- Requires documentation of method suitability in accordance with <711> and <1092>.
- EMA
- Requires validation not only for QC but also for comparative dissolution (BE/biowaiver submissions).
- Expect clear demonstration of discriminatory power: the method must distinguish formulation/process changes.
3. Example: Generic IR Tablet Validation
- For a generic metformin 500 mg IR tablet:
- Linearity: Calibration curve from (Q-45%)–120% of expected concentration, R² = 0.99.
- Specificity: Placebo formulation shows no interference at 233 nm UV detection.
- Accuracy: Spike recovery 95–105% at 3 levels.
- Precision: Intra-day RSD = 5%, inter-day RSD = 5%.
- Filter Test: Nylon filter passes, PVDF filter fails (adsorption observed).
- Robustness: Method unaffected by ±5 rpm paddle speed variation.
Step 6: Establish Sampling Strategy & Media Justification (USP vs EMA)
Once the dissolution method is validated, the next regulatory focus is defining a sampling strategy and ensuring media justification. This step directly impacts regulatory acceptance because agencies scrutinize whether the design is clinically relevant, statistically justified, and aligned with pharmacopeial standards.
1. Sampling Strategy: USP vs EMA
- USP Perspective
- USP <711> allows single-point specifications for most immediate-release (IR) products.
- Example: Q = 85% in 30 minutes (meaning NLT 85% of labeled amount should dissolve within 30 min).
- For modified-release (MR) products, USP requires multiple time points (early, middle, late).
- EMA Perspective
- EMA expects multi-point dissolution profiles in nearly all cases.
- At least 3 time points:
- Early stage (reflecting initial release)
- Middle stage (discriminatory point)
- Final stage (complete release or plateau)
- EMA insists that profiles should be compared, not just single values.
Example
For an IR generic submission:
USP acceptance: 80% in 30 min.
EMA requirement: Dissolution profiles at 5, 10, 15, 30, 45 min → must show similarity (f₂ ≥ 50).
2. Media Justification
Both USP and EMA emphasize the need for scientifically justified dissolution media.
Key Requirements:
- Physiological relevance: media should simulate GI pH conditions (1.2, 4.5, 6.8).
- Sink condition: at least 3× the volume required to dissolve the full dose.
- Surfactant use: only if solubility studies demonstrate necessity; must be justified with experimental data.
USP Guidance
Focus on simplicity and reproducibility in QC labs.
Accepts water or compendial buffers if adequately justified.
EMA Guidance
- More stringent — expects biorelevant media justification for comparative studies (bioequivalence/biowaivers).
- Surfactant use is carefully scrutinized and must mimic physiological solubilization, not artificially force dissolution.
3. Example: Sampling & Media Justification
Case: Generic Ibuprofen 400 mg IR Tablet
- USP Strategy:
- Test at 30 min → ≥ 80% release required.
- EMA Strategy:
- Profile at 5, 10, 15, 30, 45 min.
- f₂ ≥ 50 compared to reference product.
- Media Justification:
- Use pH 1.2, 4.5, and 6.8 to reflect GI tract.
- No surfactant required (ibuprofen is BCS II but soluble in buffers with adequate sink volume).
- Outcome:
- USP submission: data at 30 min sufficient.
- EMA submission: full profile + f₂ analysis required.
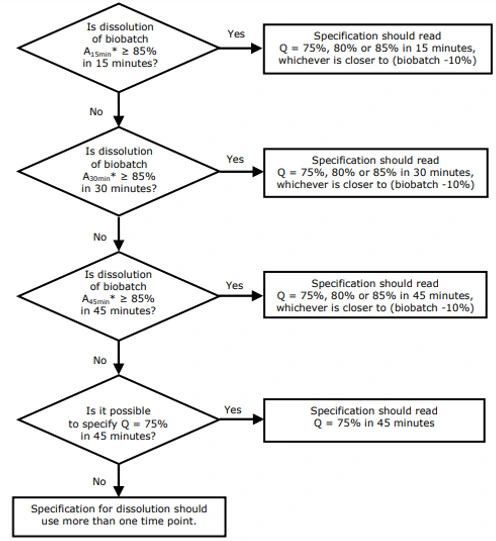
Step 7: Define Acceptance Criteria & Decision Framework (USP Q / S1–S3 vs. EMA L1–L3)
1) USP approach — Q value and staged testing (S1 / S2 / S3)
Core idea: USP sets a quantitative target (Q) — percentage of label claim dissolved at a specified time — and uses a 3-stage sampling plan to control risk.
- Define Q: Use the compendial monograph if available. If not, set Q based on clinical relevance, reference product behavior, and historical manufacturing variability.
Example: For an IR tablet, Q = 80% at 30 minutes is common. - Staged acceptance (USP <711>):
- S1 — test 6 units. Each unit must be ≥ Q + 5%. If all pass, batch accepted.
- S2 — if S1 fails, test additional 6 units (total 12). The average of all 12 must be ≥ Q, and no unit may be < Q − 15%.
- S3 — if S2 fails, test additional 12 units (total 24). The average of all 24 must be ≥ Q, with predefined limits on number/degree of individual failures (e.g., no more than 2 units < Q − 15%, none < Q − 25% check current USP wording for exact wording).
2) EMA approach: profile comparison and L1 / L2 / L3 logic
- Core idea: EMA prioritizes comparability of entire profiles (test vs. reference). The similarity factor f₂ (or approved alternatives) is the standard metric; L-stage logic mirrors S-stage thinking but applies to multi-point specifications, especially for MR products.
- Similarity factor (f₂): f₂ ≥ 50 indicates similarity (use mean profiles, 12 units, and observe variability constraints).
- L1 / L2 / L3 (conceptual): For MR products or multi-point specs, evaluate at each time point:
- L1 — initial screening (e.g., 6 units within limits at each time point).
- L2 — extended sampling if L1 fails (12 units, average must meet limits).
- L3 — final stage (24 units) to decide population-level compliance.
3) Setting Q or profile limits: scientific justification
When Q or per-timepoint limits are not in a monograph, justify them with:
- Reference product data (mean profile ± clinically meaningful bounds).
- Clinical/PK linkage — tie limits to IVIVC, if available, or to known therapeutic windows.
- Manufacturing capability — historical process variation and worst-case scenarios.
Example
You determine reference product mean at 30 min = 82% (SD 3%). A defensible Q might be 80% (rounded), with staged testing per USP; for EMA you calculate f₂ across time points—if f₂ ≥ 50, you document equivalence.
5) Common pitfalls & mitigation
- Pitfall: Selecting too narrow Q without justification → regulator queries.
- Mitigation: Base Q on reference product and historical data; include sensitivity analysis.
- Pitfall: Relying solely on f₂ when variability is high.
- Mitigation: Use bootstrap or model-dependent analyses and provide robust rationale.
- Pitfall: Omitting multi-pH data for EU filings.
- Mitigation: Run pH 1.2/4.5/6.8 profiles and include in dossier.