Abstract
Analytical Quality by Design (AQbD) applies QbD thinking to analytical methods so laboratories can design, qualify, and maintain procedures that are robust, flexible, and scientifically justified across their lifecycle. This first part explains the foundational elements—Analytical Target Profile (ATP), structured risk assessment (Ishikawa & FMEA), and the Method Operable Design Region (MODR)—and summarizes how recent regulatory guidance (ICH Q14, Q2(R2), USP <1220>) supports lifecycle-based validation and smarter change control. Practical examples (ATP template and a simplified FMEA) are provided to help QC/R&D practitioners apply AQbD principles immediately.
Introduction: From Classical Validation to AQbD Thinking
Traditional validation (ICH Q2-style) demonstrates that a method meets acceptance criteria under a specific set of conditions. While this remains important, a static approach is brittle: routine variabilities—such as column lot changes, slight buffer pH drift, or instrument replacement—often trigger repeated revalidation and investigations.
AQbD changes the mindset: instead of verifying a method at a single point, we design the method to meet a pre-defined Analytical Target Profile (ATP) and use risk management and deliberate experimentation (DoE) to understand sources of variability and define an operational space (the MODR) where the method reliably meets its ATP. This lifecycle approach increases robustness, reduces OOS frequency, and supports regulatory flexibility. (ICH.org)

Regulatory background — Harmonizing science and compliance
Recent regulatory updates mark a significant evolution from validating a method “at a point in time” to assuring its performance “across the method lifecycle.” This is embodied in three harmonized guidelines:
ICH Q14 — Analytical Procedure Development
ICH Q14 (2023) promotes the use of scientific understanding and risk-based approaches in the analytical development process. Its core messages include:
- Define the Analytical Target Profile (ATP) early.
- Use Design of Experiments (DoE) to explore critical factors.
- Establish the Method Operable Design Region (MODR).
- Comprehensive documentation of the scientific rationale.
ICH Q2(R2) — Validation of Analytical Procedures
ICH Q2(R2) aligns validation with method understanding. It emphasizes:
- Statistical treatment of precision, linearity, and robustness.
- Broader applicability to chromatographic, spectroscopic, and microbiological methods.
- A lifecycle perspective, where validation is an ongoing process of assurance.
USP <1220> — Analytical Procedure Life Cycle
USP <1220> general chapter provides a practical, three-stage model for implementing the lifecycle concept:
- Stage 1 (Procedure Design): Designing the method based on the ATP and risk assessment.
- Stage 2 (Procedure Performance Qualification): Demonstrating the method is suitable for its intended purpose (equivalent to traditional validation).
- Stage 3 (Continued Procedure Performance Verification): Ongoing monitoring to ensure the method remains in a state of control.
Table 1. Comparison of ICH Q14, ICH Q2(R2), and USP <1220> — Scope and Key Concepts
| Aspect | ICH Q14 | ICH Q2(R2) | USP <1220> |
| Primary focus | Analytical procedure development | Analytical procedure validation | Analytical procedure lifecycle |
| Core principle | Risk-based design using DoE | Statistical confidence of performance | Integration of design, validation, and monitoring |
| Key deliverable | MODR, risk assessments | Validation protocol/report | Lifecycle management plan |
| Flexibility | Encourages MODR justification | Defines acceptance criteria | Allows adaptive verification |
| Regulatory intent | Promote innovation | Harmonize methods globally | Ensure lifecycle robustness |
Core elements of AQbD
The Analytical Target Profile (ATP): Foundation of Method Validation
The Analytical Target Profile (ATP) defines what the analytical procedure is intended to measure and how well it must perform. It is the anchor of AQbD validation, linking analytical design to product quality requirements. A robust ATP should describe:
- Purpose: e.g., “Assay of active ingredient in dosage form.”
- Performance requirement: Defined, justified acceptance criteria for key parameters (e.g., precision, accuracy, range).
- Measurement target: quantitative (assay % of label) or qualitative (presence/absence).
- Link to critical quality attributes (CQAs): Explain how the analytical data will be used to assess Critical Quality Attributes.
Example ATP
The method must quantify Model Drug X and its related impurities in a tablet formulation
| Parameter | Requirement | Justification |
|---|---|---|
| Assay accuracy (bias) | ≤ 2.0 % | Ensure content claims ± clinically relevant window |
| Precision (RSD, repeatability) | ≤ 2.0 % | Demonstrate analyst/instrument reproducibility |
| Range | 80 – 120 % of label claim | Covers expected process variability |
| Specified impurity quantitation | LOQ 0.1 %, accuracy ±15% and precision (RSD) of ≤ 10%. | Detect impurities at regulatory thresholds |

Risk assessment — building method understanding
The use of quality risk management (QRM) is encouraged to aid in the development of a robust analytical procedure to reduce the risk of poor performance and reporting incorrect results. Risk assessment is typically performed early in analytical procedure development and is updated as more information becomes available. Risk assessment can be formal or informal and can be supported by prior knowledge. Risk management is the engine of AQbD. Start early and update throughout the lifecycle.
Ishikawa (Fishbone) Diagram
- The Ishikawa Diagram, also known as a Fishbone Diagram or Cause-and-Effect Diagram, is a visual tool used to systematically identify, analyze, and display the potential causes of a specific problem or effect.
- In analytical method development, a Fishbone diagram helps systematically identify all potential sources of variability or error that can affect the accuracy, precision, specificity, and robustness of a method. It’s particularly useful during HPLC, GC, or spectrophotometric method development.
- In pharmaceutical analytical method development, the 6 Ms (Man, Machine, Material, Method, Measurement, Environment) are most commonly used.
- Using this expanded version ensures robust method development and helps identify root causes for variability in assay results, impurities, or dissolution studies.
Figure 3. Fishbone Diagram of Potential Analytical Variability Sources

Failure Mode and Effects Analysis (FMEA) – ranking risks by probability, severity, and detectability.
FMEA is a proactive risk management tool used to identify potential failures in a process, evaluate their impact, and prioritize actions to reduce or eliminate risk. In pharmaceutical analytical method validation, FMEA helps ensure that methods are robust, reliable, and compliant with regulatory expectations (e.g., ICH Q2(R2), USP <1220>, and Q14 guidelines).
Purpose of FMEA in Analytical Method Validation
- Identify potential failure modes in analytical methods (e.g., HPLC, GC, UV, LC-MS).
- Assess the impact of each failure mode on method performance (accuracy, precision, specificity, robustness).
- Prioritize risks for corrective actions or design improvements.
- Support regulatory submission by providing documented risk-based justification for method parameters and controls.
Key Terms in FMEA
| Term | Definition |
| Failure Mode | The way in which a process step or component can fail (e.g., incorrect mobile phase pH, detector malfunction). |
| Effect of Failure | Consequence of the failure mode on method performance or product quality. |
| Cause of Failure | Root cause of the failure mode (e.g., operator error, equipment drift, environmental factors). |
| Severity (S) | How serious the effect of failure is on the result. Usually scored 1–10 (10 = most severe). |
| Occurrence (O) | Likelihood or probability of the failure happening. Scored 1–10 (10 = highest probability). |
| Detectability (D) | Ability to detect the failure before it impacts the method outcome. Scored 1–10 (10 = least detectable). |
| Risk Priority Number (RPN) | Numeric value calculated as RPN = S × O × D. Used to rank the risk and prioritize mitigation. |
Steps to Perform FMEA in Analytical Method Validation
Risk Matrix – visual prioritization for mitigation planning.
Table 2. Example Risk Ranking Matrix for an HPLC Assay Method
| Step | Potential Failure Mode | Effect | Cause | S | O | D | RPN | Risk Level | Mitigation/Control |
| Sample Preparation | Incomplete dissolution | Low assay result | Poor technique | 8 | 3 | 4 | 96 | Medium | Vortex/mix & visual check |
| Contamination | Incorrect assay | Dirty glassware, cross-contamination | 8 | 2 | 4 | 64 | Low | Clean glassware, SOP compliance | |
| Incorrect sample weight | Assay error | Operator error | 9 | 2 | 5 | 90 | Medium | Balance calibration, double-check weights | |
| Mobile Phase | Wrong pH | Peak shift | Buffer mispreparation | 7 | 2 | 5 | 70 | Low | SOP verification, pH check |
| Incorrect organic ratio | Retention time/peak shape change | Preparation error | 8 | 3 | 5 | 120 | Medium | SOP, verification by UV check | |
| Air bubbles | Noise/spikes | Improper degassing | 5 | 4 | 6 | 120 | Medium | Degas mobile phase, vacuum or sonication | |
| HPLC Column | Column degradation | Broad peaks | Overuse, contamination | 6 | 5 | 6 | 180 | High | Column replacement schedule, SST monitoring |
| Column Temperature | Temperature drift | Retention time shift | Oven malfunction | 7 | 3 | 5 | 105 | Medium | Oven calibration, SST checks |
| Flow Rate Stability | Flow rate drift | Retention time shift | Pump instability | 7 | 3 | 5 | 105 | Medium | Pump calibration, SST monitoring |
| Injection | Air bubbles | Noise, spikes | Improper filtration | 5 | 4 | 6 | 120 | Medium | Filter samples, degas mobile phase |
| Injection Volume | Incorrect injection volume | Peak area error | Autosampler or syringe error | 6 | 3 | 5 | 90 | Medium | Autosampler calibration, verification |
| Detector Wavelength | Wavelength deviation | Peak response variation | Lamp drift, wrong setting | 6 | 2 | 4 | 48 | Low | Lamp calibration, scheduled replacement |
| Data Processing | Integration error | Wrong assay | Manual or software error | 9 | 3 | 5 | 135 | Medium | Standard integration parameters, software SOP |
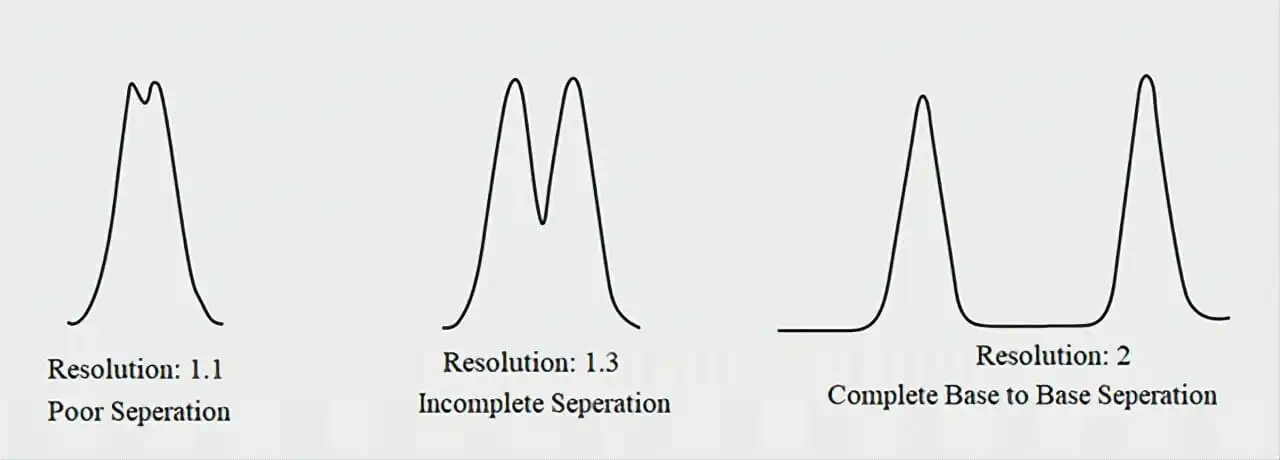
| System Suitability Test | Tailing factor out of limit | Poor peak shape | Column degradation or mobile phase | 7 | 3 | 4 | 84 | Medium | SST before each run |
| Theoretical plates out of limit | Poor resolution | Column efficiency loss | 8 | 3 | 4 | 96 | Medium | SST monitoring, column replacement | |
| Carryover | Residual analyte from previous injection | False high results | Insufficient washing | 7 | 3 | 5 | 105 | Medium | Rinse program, blank injection check |
| Detector Noise | Baseline noise increase | Poor signal-to-noise ratio | Lamp aging, electronic drift | 6 | 4 | 5 | 120 | Medium | Lamp replacement, electronics maintenance |
| Environmental Factors | Temperature fluctuations | Retention time/assay variability | Lab temp changes | 6 | 4 | 5 | 120 | Medium | Controlled environment, monitoring |
| Vibration | Detector/column instability | Nearby equipment | 5 | 3 | 6 | 90 | Medium | Isolate HPLC, damping pads |
Once the risk associated with each factor and variable has been determined, planning for how to manage those risks occurs. The risk for those variables that are well understood may be mitigated by controlling them within a certain range (control variables). Other variables will be difficult or impractical to control, and the risks associated with them will need to be accepted (noise variables). For variables where there may be higher risk, one way to reduce risk is to gain additional knowledge about the influence of those parameters using modeling and/or experimentation.
Risk Assessment Integration into AMV Lifecycle
Method Development:
- Identify CMPs and CQAs.
- Use DoE to understand method sensitivity and robustness.
Method Validation:
- Perform risk assessment (FMEA, ranking) to focus validation efforts on high-risk parameters.
- Validate robustness, accuracy, precision, specificity, LOD/LOQ.
Routine Use / Control:
- Implement control strategy (SST, calibration, QC checks).
- Monitor trending to detect drift or failures early.
Continuous Improvement:
- Update risk assessment after method changes or deviations.
- Maintain documentation for regulatory inspections.
Documentation Recommendations
- Risk Assessment Summary Table: Shows CMPs, CQAs, RPN, mitigation actions.
- FMEA Worksheet: Includes all failure modes, scoring, and controls.
- Robustness Data: From DoE or robustness studies.
- Change Control & Deviation Logs: Update risk assessment when deviations occur.
- Lifecycle Risk Management: Maintain version-controlled risk assessment throughout method life.
Conclusion and Outlook
The transition from a traditional, static validation approach to the dynamic, science-based AQbD framework represents a significant advancement in analytical science. By defining a clear ATP, systematically understanding and controlling variability through risk assessment and DoE, and establishing a MODR-based control strategy, laboratories can achieve unparalleled method robustness and flexibility.
This proactive lifecycle management reduces the frequency of OOS results, streamlines method transfer, and provides a regulatory platform for more agile change management. The harmonization of ICH Q14, Q2(R2), and USP <1220> provides a clear and supportive regulatory pathway for this modern approach.
In Part II of this series, we will delve into the practical implementation of the AQbD lifecycle, exploring advanced DoE case studies, continuous verification strategies, and the management of method changes within the MODR, providing a complete roadmap for deploying AQbD in a modern QC environment.
References
- ICH Q14: Analytical Procedure Development, 2023.
- ICH Q2(R2): Validation of Analytical Procedures, 2023.
- USP <1220>: Analytical Procedure Lifecycle, 2022.
- FDA. Guidance for Industry: Analytical Procedures and Methods Validation for Drugs and Biologics, 2023.
- WHO Technical Report Series No. 1025, Annex 8, 2020.
- ICH Q9 (R1): Quality Risk Management (2023).
- Rathore, A.S. et al., Analytical Quality by Design: Concepts and Applications, J. Pharm. Biomed. Anal., 2019.
- Peraman, R., Bhadraya, K., Reddy, Y.P., Analytical Quality by Design: A Tool for Regulatory Flexibility and Robust Analytics, Int. J. Anal. Chem., 2015.
- Bhatt, D.A.; Rane, S.I. QbD Approach to Analytical RP-HPLC Method Development and its Validation. Int. J. Pharm. and Pharm. Sci. 2011, 3(1) 179-187.
- Schweitzer, M., et al. “Implications and Opportunities of Applying QbD Principles to Analytical Measurements.” Pharmaceutical Technology, 2010.